Microsoft Releases a Preview of the Integration of Prometheus with Azure Monitor
Recently Microsoft announced the integration of Prometheus, a popular open-source metric monitoring solution and part of Cloud Native Compute Foundation, with Azure Monitor for containers. This integration is currently available in a preview stage for testing.
The Prometheus integration is a result of requests from customers for a way to have its data available in the Azure Monitor for containers. Moreover, this data provides more significant insights into AKS workloads than the out-of-the-box information Azure Monitor for Containers obtains. This Azure service only allows access to inventory, health, events, logs and performance information in AKS environments, as well as Azure Container Instances environments.
Heiko Harada, senior program manager, Azure Monitoring & Diagnostics, said in the blog post about the preview:
With the additional workload metrics from Prometheus, you now get full-stack, end to end monitoring view for your Azure Kubernetes Services (AKS) in Azure Monitor for containers.

Source: https://azure.microsoft.com/en-us/blog/azure-monitor-for-containers-with-prometheus-now-in-preview/
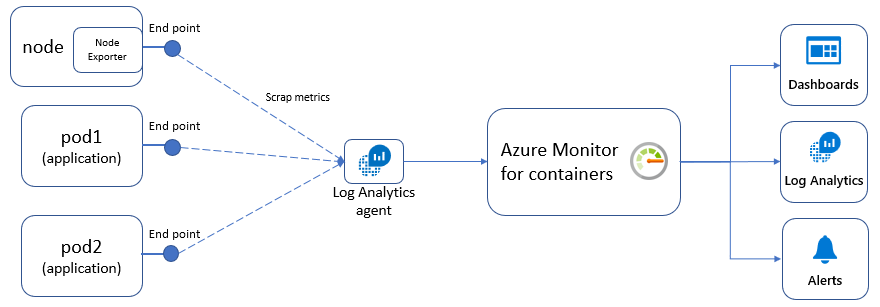
With the integration of Prometheus and Azure Monitor for containers, users no longer need to set up a Prometheus server. Consequently, they only need to expose the Prometheus endpoint through their exporters or pods (application), and the containerized agent for Azure Monitor for containers will scrape the metrics. Finally, through Azure Monitor for containers, users can visualize and create alerts for the Prometheus metrics.

Also, with the integration, users can create queries using the Kusto Query Language for the workload data which Prometheus can pull at the cluster-wide level or the node-wide level according to the Microsoft documentation. For the available metrics, users can visit the Prometheus website.
In a blog post about the integration, Sam Cogan, solution architect and Microsoft Azure MVP, stated:
Being able to stick with a standardized and straightforward method for instrumenting applications should make life easier for developers. Not needing to deploy and manage a complex Prometheus environment with global aggregation and availability will make things much simpler for those running clusters. Finally, have this data in a single place, where it can be queried and alerted on will be a big help for operations.
Lastly, Prometheus provides rich and extensive telemetry; if users need to understand the cost implications, there is a query available, which will show them the data ingested from Prometheus into Azure Monitor logs.


